

Published · By Jeff Brick, 2026 SDMLS President
Quick answer: San Diego home prices in October 2026 ranged from a median of $570,000 for a house in Barrio Logan to $5,272,500 in Rancho Santa Fe, according to my pull of San Diego MLS (SDMLS) data for the 50 neighborhoods I cover. Most of the city’s core neighborhoods landed between about $1 million and $1.9 million for a single-family home, while condo medians ran from roughly $400,000 to $1.5 million. Prices rose year over year in 22 of the 35 ZIP codes and cities below and fell in 12.
📍 Every area below has its own guide. Explore all of my San Diego neighborhood guides, or try the Neighborhood Finder to match your budget in about 30 seconds.
I’m Jeff Brick, a San Diego REALTOR® with Compass and the 2026 President of the San Diego Multiple Listing Service. Every month I pull the closed sales myself, so the figures here are the same ones I use when I price a home for a client. All numbers are San Diego MLS, October 2026, compared with October 2025, unless noted.
San Diego home prices by neighborhood: the October 2026 numbers
These are median sale prices for single-family homes (houses), by ZIP code or city. Neighborhoods that share a ZIP code share the same figure, and several areas had fewer than 10 sales, so treat those as a snapshot rather than a trend.
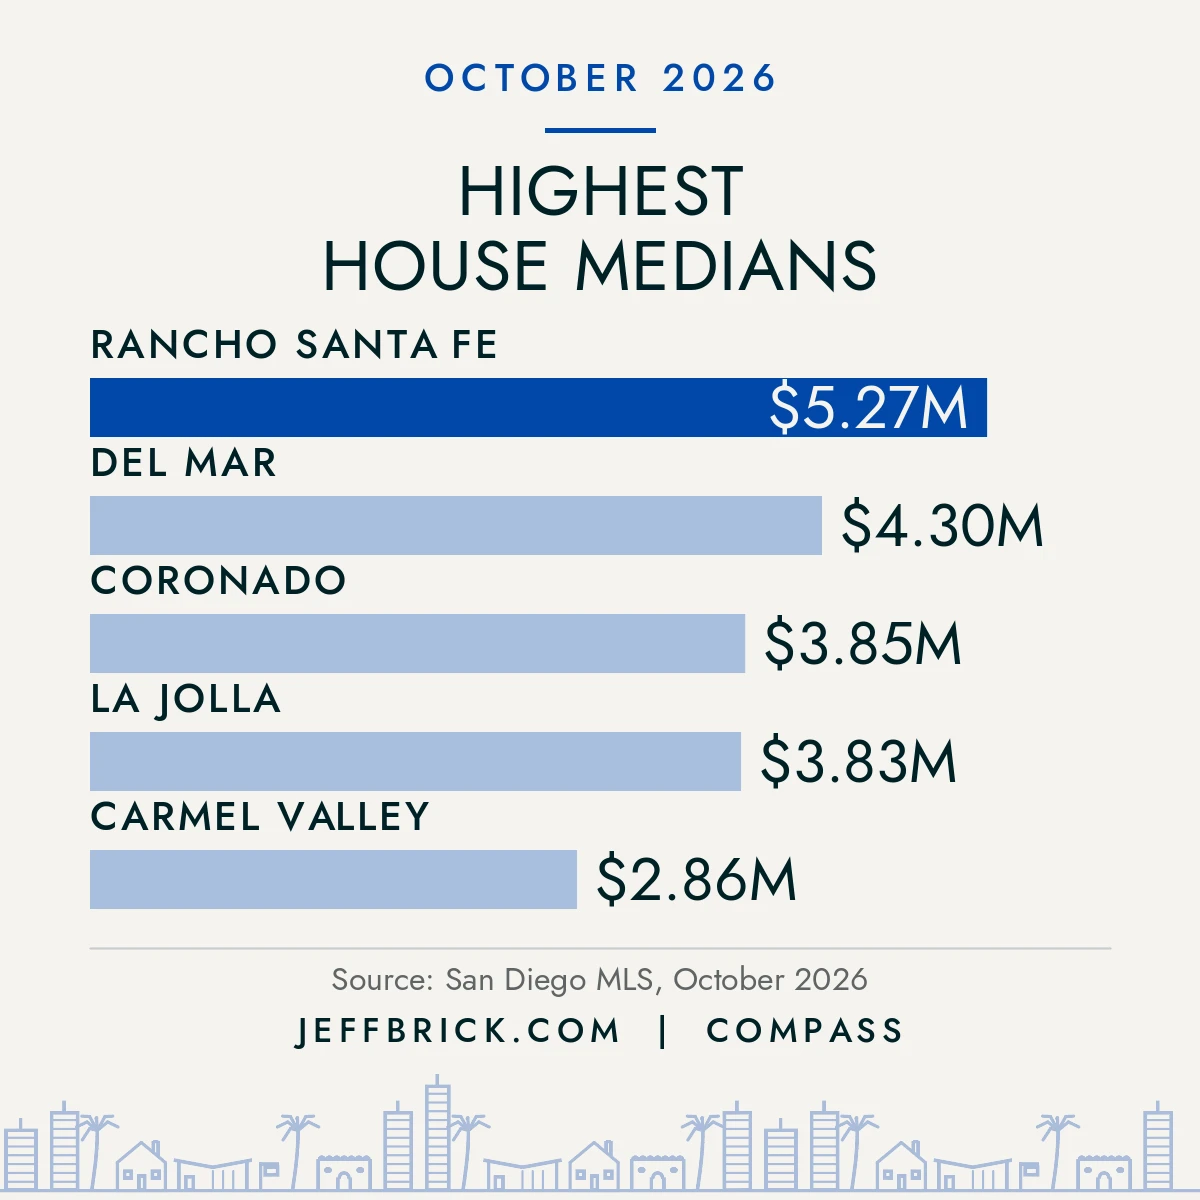
Coastal San Diego
| Area | Median house price | vs. Oct 2025 | Houses sold | Median days on market |
|---|---|---|---|---|
| Rancho Santa Fe (92067) | $5,272,500 | -9% | 10 | 69 |
| Del Mar and Del Mar Heights / Torrey Pines (92014) | $4,300,000 | -3% | 5 | 69 |
| Coronado (92118) | $3,850,000 | 0% | 11 | 18 |
| La Jolla (92037) | $3,825,000 | +16% | 25 | 27 |
| Pacific Beach and Mission Beach (92109) | $2,622,500 | +17% | 10 | 15 |
| Encinitas (city) | $2,300,000 | +2% | 25 | 14 |
| Carlsbad (city) | $1,909,000 | +12% | 40 | 10 |
| Ocean Beach (92107) | $1,899,000 | -4% | 7 | 9 |
| Point Loma and Liberty Station (92106) | $1,860,000 | -9% | 9 | 58 |
| Oceanside (city) | $1,060,000 | +13% | 37 | 20 |
Uptown, Mid-City and the urban core
| Area | Median house price | vs. Oct 2025 | Houses sold | Median days on market |
|---|---|---|---|---|
| Hillcrest, Mission Hills and Bankers Hill (92103) | $1,693,500 | -7% | 8 | 9 |
| University Heights, Normal Heights and Kensington (92116) | $1,360,000 | +10% | 17 | 9 |
| North Park and Burlingame (92104) | $1,200,000 | +5% | 11 | 8 |
| Talmadge and the College Area (92115) | $921,500 | +9% | 18 | 31 |
| Golden Hill and South Park (92102) | $689,000 | -14% | 11 | 21 |
| Barrio Logan (92113) | $570,000 | -13% | 9 | 61 |
Central San Diego and North City
| Area | Median house price | vs. Oct 2025 | Houses sold | Median days on market |
|---|---|---|---|---|
| Carmel Valley (92130) | $2,860,000 | +30% | 14 | 25 |
| 4S Ranch and Santaluz / Black Mountain Ranch (92127) | $1,850,000 | -1% | 23 | 15 |
| Bay Park (92110) | $1,850,000 | +36% | 5 | 7 |
| University City (92122) | $1,725,000 | +6% | 15 | 16 |
| Scripps Ranch (92131) | $1,700,000 | -17% | 20 | 19 |
| Tierrasanta (92124) | $1,525,000 | +33% | 5 | 12 |
| Rancho Peñasquitos (92129) | $1,470,000 | +11% | 10 | 10 |
| Rancho Bernardo (92128) | $1,270,000 | +6% | 29 | 12 |
| San Carlos (92119) | $1,193,500 | +20% | 8 | 10 |
| Clairemont (92117) | $1,132,500 | +1% | 26 | 13 |
| Mira Mesa (92126) | $1,030,000 | -4% | 15 | 11 |
| Allied Gardens / Del Cerro (92120) | $992,500 | -17% | 14 | 7 |
Inland North County, East County and South Bay
| Area | Median house price | vs. Oct 2025 | Houses sold | Median days on market |
|---|---|---|---|---|
| Eastlake, Chula Vista (91915) | $1,225,000 | +34% | 4 | 73 |
| Bonita (91902) | $1,189,000 | +21% | 7 | 14 |
| Poway (92064) | $1,150,000 | +10% | 25 | 25 |
| Otay Ranch, Chula Vista (91913) | $1,029,500 | +8% | 14 | 16 |
| Mount Helix (91941) | $990,000 | -13% | 18 | 11 |
| Escondido (city) | $985,000 | +14% | 55 | 20 |
| La Mesa (city) | $932,750 | +6% | 34 | 13 |
Where houses still sell under $1 million
Seven of the areas I track had a median house price under $1 million in October. If that’s your ceiling, these are the places to start, and the guides break down what that money buys block by block.
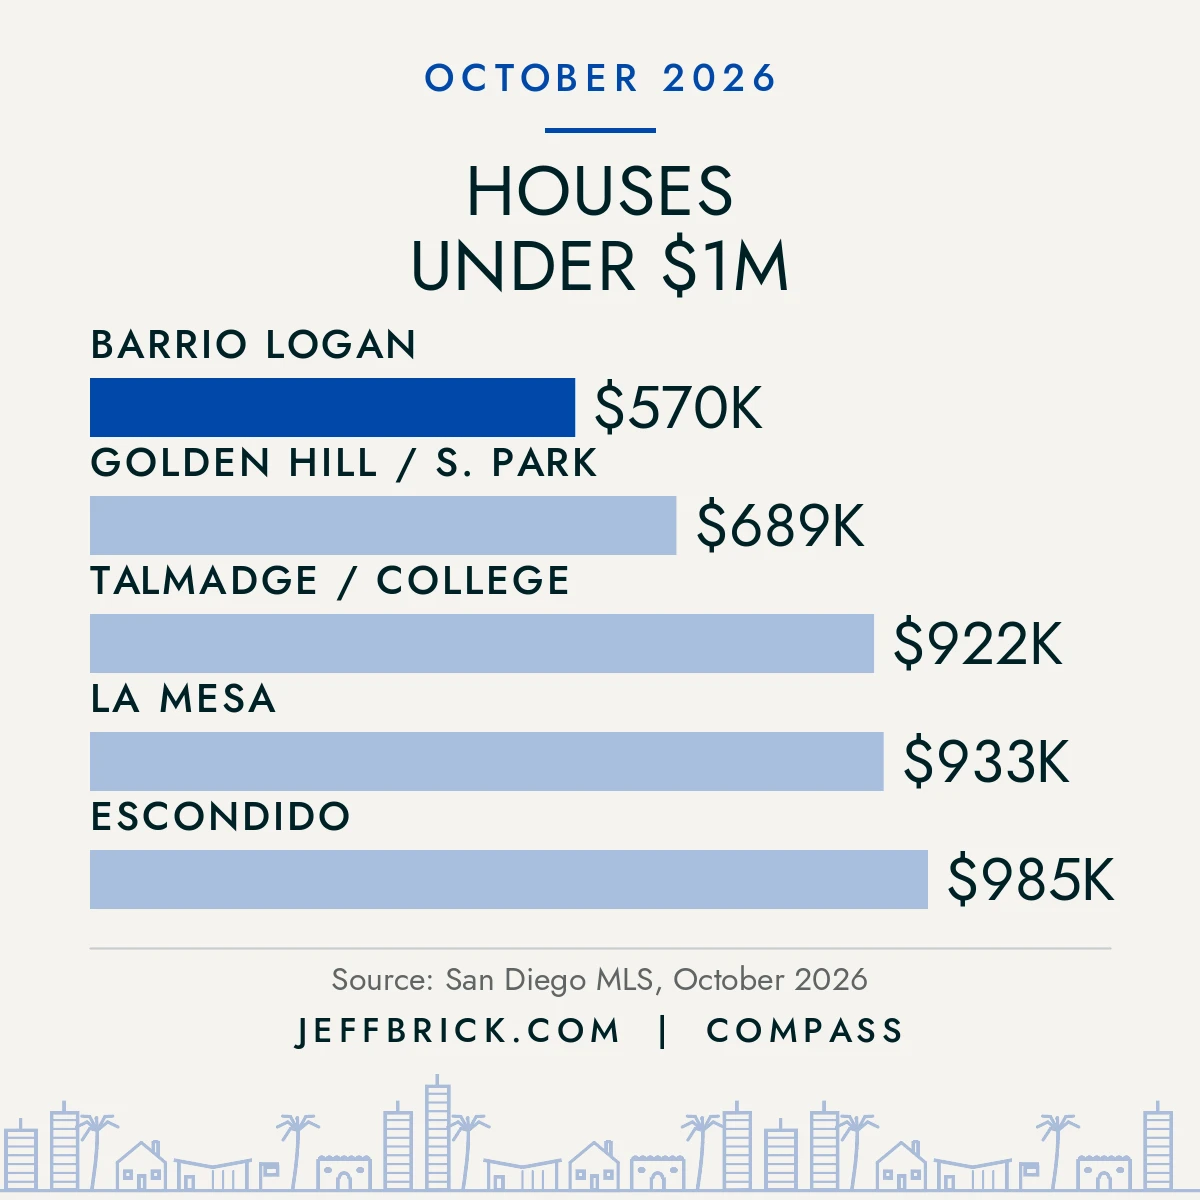
Allied Gardens / Del Cerro ($992,500) and Mount Helix ($990,000) round out the list. Keep in mind that a low median can reflect smaller homes or a few lower-priced sales in a thin month, not just a cheaper neighborhood. That’s why I always look at price per square foot alongside the median.
Average vs. median home price in San Diego
People search for the “average home price in San Diego,” but the median is the better number. The median is the middle sale: half sold for more, half for less. An average gets dragged up by a single $10 million estate, which is why one big sale can make a neighborhood look far pricier than it is. Every price in this post is a median.
What I do average is price per square foot, because it helps compare homes of different sizes. In October it ranged from $386 a square foot in Eastlake to $1,692 in Coronado among houses, with North Park at $968 and La Mesa at $580 (San Diego MLS, October 2026). If you want to see how that applies to your own place, my post on how agents really price a San Diego home walks through it, and why online estimates never agree covers the Zillow question.
Condo and townhome prices
Condos tell a different story than houses right now. Many condo medians fell from a year ago, and supply is higher, which gives buyers more room to negotiate.
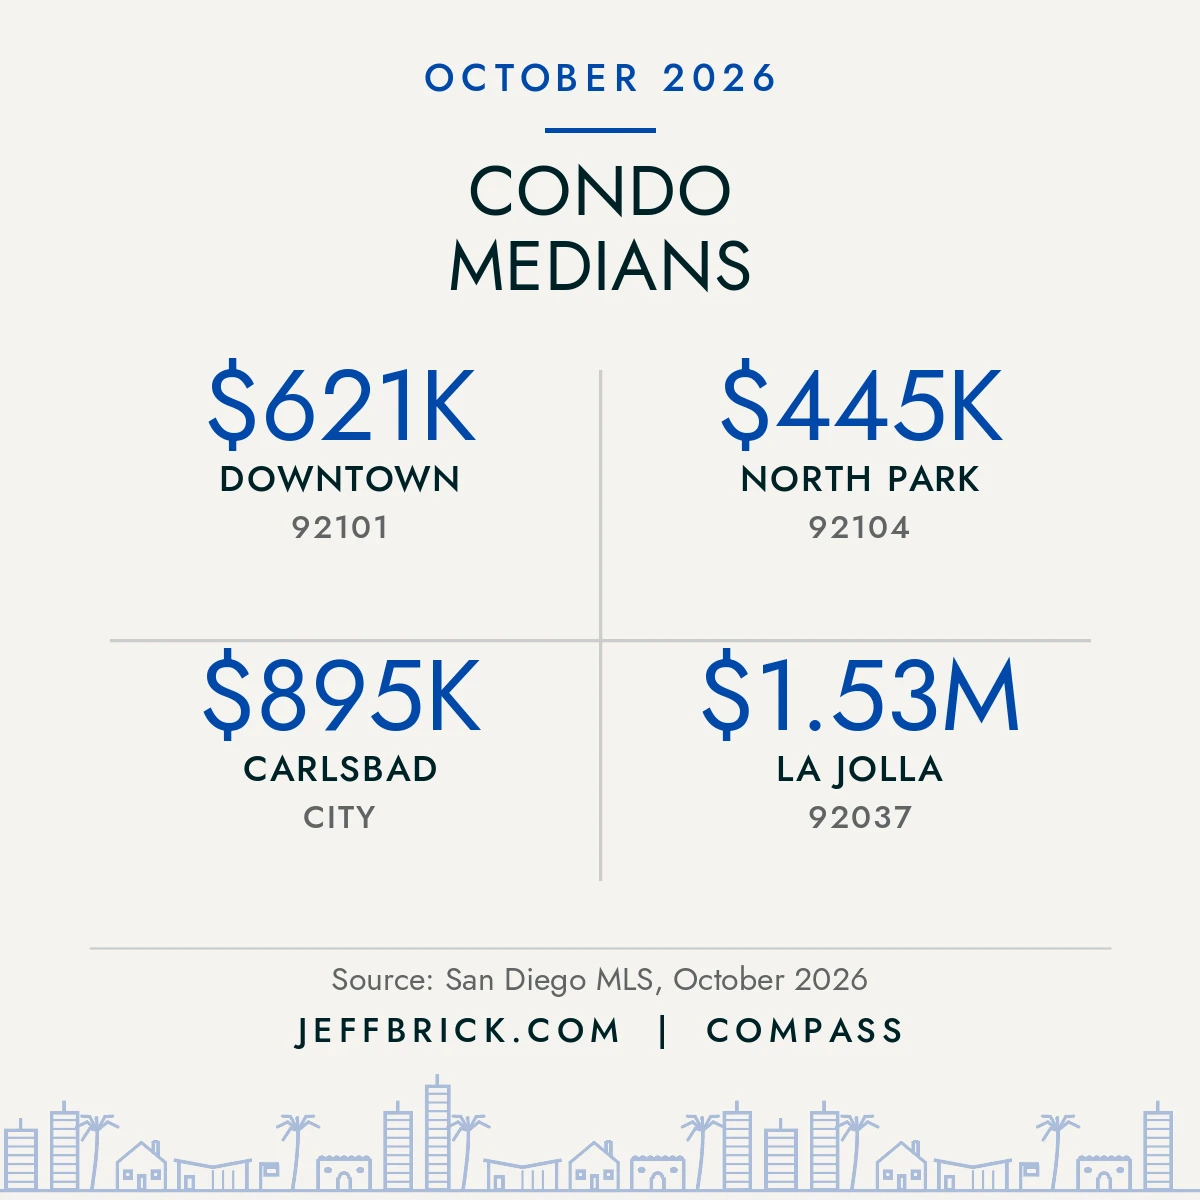
Downtown had the most condo sales of any area I track, 50 in October at a $621,250 median, down 8% from a year earlier, with 6.6 months of inventory. North Park condos sold at a $445,000 median, down 23%. For a closer look at what’s happening there, see my guide to price reductions on San Diego homes, condos and townhomes and my checklist for buying a luxury condo downtown.
What today’s mortgage rate does to these prices
The 30-year fixed rate averaged 7.18% the week of November 5, 2026, up from 6.22% a year earlier, according to Freddie Mac’s Primary Mortgage Market Survey. On an $800,000 loan (a $1 million home with 20% down), principal and interest at 7.18% comes to about $5,419 a month, roughly $509 more than the same loan at last year’s 6.22%. Taxes, insurance and any HOA come on top of that.
That gap is why sellers in some areas are cutting prices while others still get over asking. Check what your own numbers look like with my San Diego mortgage calculator, and see how much you need to buy a home in San Diego. This is general information, not lending or financial advice; confirm your own payment with a lender.
How to read these numbers
- Small samples swing. Bay Park (5 sales), Tierrasanta (5), Del Mar (5) and Eastlake (4) can jump 30% in a month on just one or two sales. Look at three to six months before drawing conclusions.
- Days on market matter as much as price. North Park houses sold in a median 8 days, while Eastlake took 73. Fast markets leave little room to negotiate.
- ZIP codes cover more than one neighborhood. Hillcrest, Mission Hills and Bankers Hill share 92103, so they share one figure here even though streets within them differ a lot.
- Renters, this matters too. If you’re weighing renting longer against buying, my rent vs. buy calculator uses these same price levels.
Jeff’s take
San Diego isn’t one market; it’s fifty. The same week a Carmel Valley house climbs 30% year over year, a Scripps Ranch house can be down 17%. Headlines about “San Diego prices” average all of that away. If you’re buying, the opportunity is in the areas where homes are sitting longer and condos are carrying more inventory. If you’re selling, your price should come from your own ZIP code’s last 90 days of sales, not the countywide headline. I pull these numbers every month, and I’m happy to run them for your street.
Want the numbers for your block?
Get a quick ballpark from Instant Home Value, then I’ll follow up with a free written analysis. Or call or text me at 858-324-4448. I’m Jeff Brick, REALTOR® with Compass (DRE# 02156850), 2026 President of the San Diego Multiple Listing Service, a 2024–2026 Director of the San Diego Association of REALTORS®, and a Southern California luxury apartment home leasing broker. Million Dollar Service at All Price Points.
San Diego Home Prices FAQ
What is the median home price in San Diego right now?
It depends heavily on the neighborhood. In San Diego MLS data for October 2026, median house prices across the 50 neighborhoods I cover ranged from $570,000 in Barrio Logan to $5,272,500 in Rancho Santa Fe, with most core city neighborhoods between about $1 million and $1.9 million.
Are San Diego home prices going down?
Not across the board. Median house prices rose year over year in 22 of the 35 ZIP codes and cities I track, fell in 12 and were flat in one (San Diego MLS, October 2026). Condo prices were softer, with many areas down from a year ago.
Which San Diego neighborhoods have houses under $1 million?
In October 2026, Barrio Logan, Golden Hill and South Park, Talmadge and the College Area, La Mesa, Escondido, Mount Helix and Allied Gardens / Del Cerro all had median house prices under $1 million, based on San Diego MLS data.
Why use the median instead of the average home price?
The median is the middle sale, so a handful of very expensive homes can’t skew it. An average can be pulled far higher by one luxury sale, which makes it a poor guide to what a typical home costs.
How often are these San Diego home prices updated?
I pull San Diego MLS figures every month and update my neighborhood guides with them. My free monthly newsletter, The San Diego Insider, sends your neighborhood’s numbers on the 5th of each month.